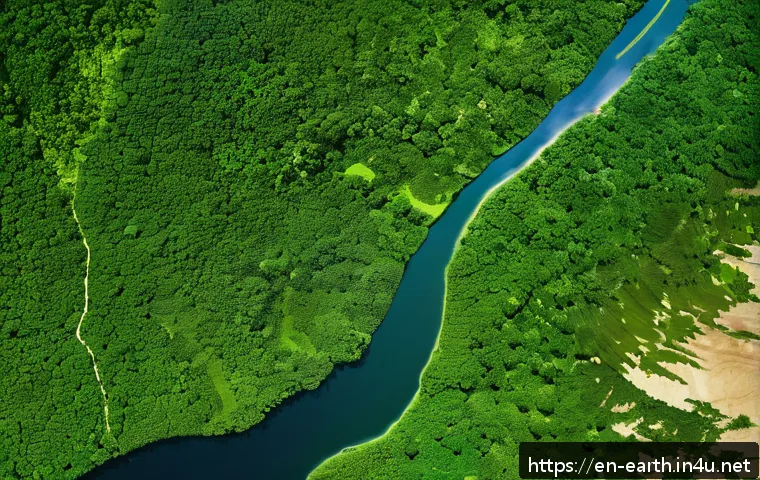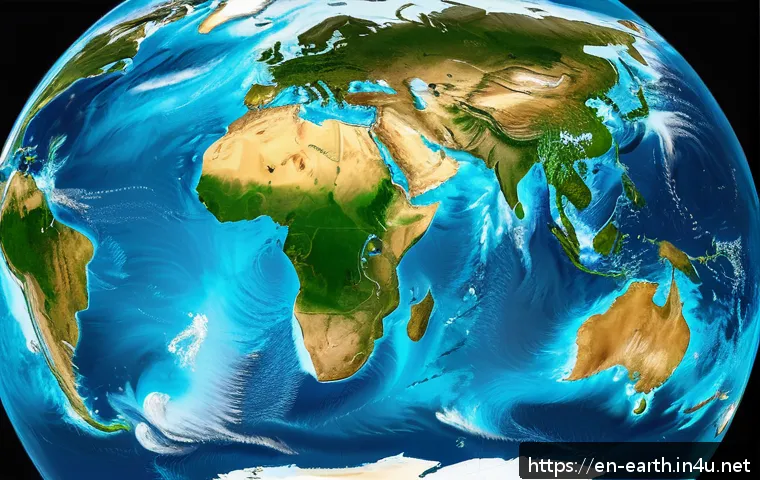
Earth science data analysis converts observations from satellites, sensors, field surveys, and models into evidence that can support a scientific question.

The most reliable starting point is to verify data quality and context—especially metadata, units, locations, and observation times—before selecting an analytical method.
Environmental datasets often combine spatial and temporal information, so raw values rarely tell the full story on their own. A map may reveal geographic clustering, while a time-series chart can show change or variability.
The right workflow depends on the dataset, its uncertainty, its scale, and the question being asked. The sections below outline a practical way to move from source data to clearly communicated results.
What Earth Science Data Can Tell You
Earth science data analysis helps turn environmental observations into interpretable findings. It can support questions about conditions in the atmosphere, ocean, land surface, water systems, or geological settings. The result is not simply a collection of numbers; it is an evidence-based description of patterns, changes, relationships, or uncertainty within the available data.
Common data types and observation sources
Common datasets include atmospheric, oceanic, geological, hydrological, and land-surface observations. They may come from satellites, fixed or mobile sensors, field surveys, or scientific models. Each source has its own coverage, measurement approach, resolution, and limitations, so datasets that appear similar may not be directly comparable. Collection methods, completeness, accuracy, and licensing terms should be checked for any specific source.
Linking research questions to measurable variables
Start with a question that can be connected to observed variables. For example, a geographic-change question may require coordinates and repeated observations across time, while a question about environmental variation may require a time-stamped measurement series. Define what will be measured, where it applies, and which period is relevant before downloading or combining data. The exact region, time period, and research question will vary by project and should guide every later choice.
Prepare Data Before Analysis
Preparation is where many avoidable mistakes are found. Before calculating summaries or making maps, review how the records are structured and whether the values can be interpreted consistently. A clean-looking table can still contain incompatible units, incomplete records, or location fields that do not match the intended study area.
Check metadata, units, coordinates, and time stamps
Metadata provides the context needed to interpret a dataset. Review the meaning of each variable, its measurement units, the coordinate information, the time stamps, and any notes about how observations were collected. Coordinates determine where a measurement belongs, while time stamps determine whether records can be compared as simultaneous or sequential observations. Unit inconsistencies should be identified before values are merged, summarized, or visualized.
Handle missing values and potential measurement errors
Data cleaning may involve locating missing values, duplicate records, inconsistent units, and potential sensor-related errors. Do not treat every unusual value as an error automatically: an extreme observation may be scientifically meaningful, or it may reflect a measurement issue. Flag questionable records, document the reason for any cleaning decision, and retain enough information for another analyst to understand what changed. The appropriate treatment depends on the dataset and the uncertainty associated with its collection.
| Preparation check | Why it matters | Practical action |
|---|---|---|
| Metadata | Defines variables and collection context | Read dataset notes before analysis |
| Units | Incompatible values can distort comparisons | Identify and document unit consistency |
| Coordinates | Support correct geographic interpretation | Check location fields and spatial coverage |
| Time stamps | Establish observation order and timing | Review format, sequence, and period covered |
| Missing or duplicate records | Can bias summaries and visual outputs | Flag, assess, and record handling choices |
Choose Analysis Methods for the Question
Methods should follow the research question rather than the other way around. A method that is useful for one dataset can be misleading for another if the spatial scale, time coverage, uncertainty, or underlying variables differ. Begin with straightforward summaries, then add spatial, temporal, or relationship-based analysis only when the data can support it.
Mapping spatial patterns and geographic change
Maps are useful when location is part of the evidence. They can show where observations are concentrated, where values differ across an area, or how geographic patterns appear to change between observation periods. Ensure that coordinates are understood and that the map reflects the coverage and scale of the source data. A blank area may indicate missing observations rather than an absence of the environmental feature being studied.
Analyzing trends, variation, and relationships over time
Time-series charts and statistical summaries can help identify variation, possible trends, and relationships among variables. Compare observations only when their timing, units, and measurement context are compatible. A visible pattern is a starting point for interpretation, not automatic proof of a cause. Describe what the data show, distinguish it from what remains uncertain, and avoid claims that extend beyond the available records.
Visualize and Communicate Results
Clear communication makes analysis easier to review and use. Good visuals reduce the effort required to see the main evidence, but they should not hide missing data, uneven coverage, or uncertain measurements. Select the format that best matches the question instead of using the same chart for every dataset.

Select charts and maps that match the evidence
Use maps for location-based patterns, time-series charts for observations that change through time, and statistical summaries for concise comparisons of a dataset’s values. Label variables and units clearly. Make the time period and geographic extent visible where relevant. Raw tables may still be useful as supporting material, especially when readers need to inspect individual records.
Report uncertainty, limits, and reproducible steps
State the known limits of the dataset, including any concerns about accuracy, completeness, source methods, or coverage. If those details are unavailable, note that verification is needed rather than assuming reliability. A reproducible workflow records the data source, preparation choices, analytical steps, and visualization decisions. Specialized software, programming skills, or laboratory validation may be needed in some projects, depending on the data and scientific objective.
Build a Repeatable Workflow
A repeatable workflow keeps an analysis organized from the first question to the final figure. First, define the question and the measurable variables needed to address it. Next, inspect metadata and clean the dataset while recording decisions about missing, duplicate, inconsistent, or questionable records. Then choose visual and analytical methods that fit the spatial and temporal structure of the data. Finally, communicate findings with clear labels, stated limitations, and enough documentation for the work to be checked or repeated.
Closing Thoughts
Earth science data becomes more useful when its context travels with it. Metadata, units, coordinates, and time stamps are not administrative details; they shape what a value can mean. Careful preparation also makes later maps, charts, and summaries more trustworthy. The goal is to make claims that match the evidence and its limits.
Useful Information to Keep in Mind
1. Match variables to the research question before choosing methods.
2. Check metadata and measurement context before combining datasets.
3. Use maps for spatial evidence and time-series charts for change through time.
4. Document cleaning choices and uncertainty throughout the workflow.
Key Points
Earth science data analysis requires more than calculation: it requires careful interpretation of location, timing, units, metadata, and data quality. The best method depends on the scientific question, dataset structure, scale, and uncertainty. Clear visualization and documented steps help keep conclusions transparent and reproducible.
Frequently Asked Questions
Q1. What is Earth science data analysis?
A1. Earth science data analysis is the process of examining environmental observations from sources such as satellites, sensors, field surveys, and models to identify patterns, changes, relationships, or uncertainty. It includes preparing data, selecting appropriate methods, visualizing results, and interpreting findings within the limits of the data.
Q2. Which tools are commonly used to analyze geospatial and environmental data?
A2. The appropriate tools depend on the dataset and the task. Geospatial data may require mapping or spatial-analysis software, while tabular environmental records may be explored with spreadsheet, statistical, or programming tools. Some projects may also require specialized software, programming skills, or laboratory validation, so the requirements should be confirmed for the specific analysis.
Q3. How do I check the quality of climate or satellite data?
A3. Begin by reviewing metadata, collection methods, measurement units, coordinates, and time stamps. Check for missing values, duplicate records, inconsistent units, and possible sensor-related errors. Also assess available information about accuracy, completeness, coverage, and licensing terms. If these details are not available, treat the dataset’s limits as uncertain and seek further verification before making strong claims.